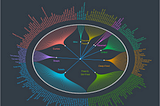
Paul ApivatinTowards Data ScienceExploring Thai Food with DataAn end-to-end exploratory data project using R and PythonMar 19, 20212Mar 19, 20212
Paul ApivatWhen a popular data science advice falls on deaf earsPitfalls to avoid for new data scientistsFeb 21, 2021Feb 21, 2021
Paul ApivatStudent Debt is Heavier for African AmericansUsing R to visualize disparities in student debt and college attainmentFeb 18, 2021Feb 18, 2021
Paul ApivatWill cryptography save us from violence?In light of recent euphoria, here’s a compelling bear case.Feb 17, 2021Feb 17, 2021
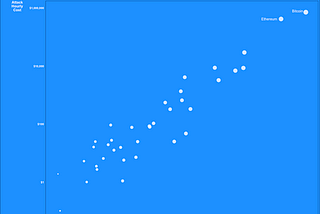
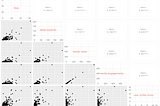
Paul ApivatValuable Public Blockchain are Harder to AttackUsing R and Python to visualize the relationship between Market Cap and Hourly Cost to AttackFeb 7, 2021Feb 7, 2021
Paul ApivatinTowards Data ScienceHow Positive are Your Facebook Posts?Rule-based Sentiment Analysis Using Python and RJan 29, 2021Jan 29, 2021
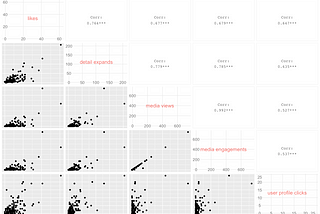
Paul ApivatinTowards Data ScienceQuickly Analyze Relationships in your Twitter DataUse R to find out which metrics drive people to click on your profileJan 16, 2021Jan 16, 2021
Paul ApivatinPython in Plain EnglishGrasping Gradient Descent using PythonUsing code to develop a feel for how machine learning optimization worksDec 26, 2020Dec 26, 2020
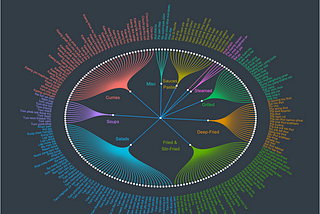
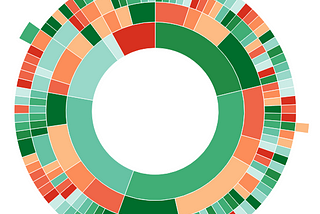
Paul ApivatinTowards Data ScienceVisualize Nested Data with Sunburst plots in RExploring the BBC’s Top 100 Influential Women of 2020 with interactive plotsDec 18, 20201Dec 18, 20201